Showing posts with label tax the wealthy. Show all posts

Sunday, September 8, 2024

September, 2024, Part 3, Political Class Insanity: Stupid Tax Ideas Around The World, Possible NYC Government Corruption, Skyrocketing National Debt and More

 Every month we devote posts to just general political class insanity that is running rampant through the country. The members of the American political class continue to show that they are incapable of efficiently operating any level of government in this country. 


Even their best efforts are almost always ineffective at resolving any problem facing Americans. They spend a great amount of time not trying to improve the lives of their citizens but continually ensuring their reelection and enriching themselves, their families, and their friends in the process, all at taxpayer expense.


1)We have  made a career talking about the  corruption of the American political class, how their self-enrichment is far more important than serving Americans. This corruption culture exists at all levels of government, from the Federal government in D.C. to the smallest town governments across the country.


Recently, alleged corruption was exposed in the biggest city in the country,  New York City:


  • Recently, the FBI raided the homes of five high ranking members of the New York City mayor’s staff,  Eric Adams.

  • The FBI agents  seized electronic devices during their home searches.

  • The five folks being raided included two deputy mayors, the city’s school chancellor, the NYPD commissioner and  an advisor to the mayor.

  • Oh, in case we forget, the mayor himself is under scrutiny for election campaign fundraising and possible ties to the Turkish government.

  • Edward Caban, the NYPD commissioner, not only had his home raided and his phone taken by the FBI, other high ranking NYPD people also had their phones confiscated.


The good news is that in this country these folks are assumed innocent until proven guilty. The other good news is that if these folks were actually involved in self enrichment and illegal activities, it is refreshing that maybe some political folks will actually and finally face consequences for their actions.


2)Speaking of corruption, we have often talked about Hunter Biden, Joe Biden’s son, and his shady dealings with shady characters around the world, from the Ukraine to Russia to China among other countries. Congressional  hearings have previously found upwards of 20 shell companies that the Biden family used to launder money and enrich themselves.


Hunter Biden has already been found guilty of Federal gun charges and then surprised the world this past week when he pleaded guilty to tax evasion. He was accused of evading taxes to the tune of $1.4 million.


And he did not plead guilty to just one or two charges but nine tax evasion charges, indicating that this was a very involved tax con or incredibly stupid tax preparation. These transgressions allegedly occurred between 2016 and 2019. His sentencing will be later this year in December. He is also facing up to 25 years of prison time for his gun charges.


All of which raises the question: will he actually go to prison for his illegal income tax and gun actions or will his daddy rescue him, and shield the Biden family’s money laundering and influence peddling schemes, by giving him Presidential pardons?  One theory is that he pleaded guilty now rather than go through a trial because the trial may extend past his father’s Presidency and thus, he could not then be pardoned by dad.


Given the political class we have discussed over the years, the smart betting money is that Hunter Biden will not spend a single day in prison for his felonious behavior. Time will tell. If you or I committed these law breaking actions there is not doubt we are going to prison.


3)We have all too often discussed the failures of the Biden Presidency across so many different dimensions: illegal immigration, foreign affairs and diplomacy, economic policy, etc. But he has also been outstanding in overwhelming the country with Federal government’s national debt:


  • In  fiscal 2023, the Federal government via the Biden administration spent a mind boggling $6,200,000,000,000.

  • That comes out to about $17 billion a DAY.

  • Furthermore, it comes  out to $700 million an HOUR.

  • The Federal government collected $4.7 TRILLION in taxes in 2023, probably the most money EVER collected by any level of any government in any country and yet Biden spent $1.5 TRILLION more than what was collected, about 32% over his tax revenue budget.

  • As we have  calculated in the past, at a national debt $35 TRILLION, mush of which was created by the Obama/Biden and Biden/Harris administrations, every man/woman/kid in the country would have  to write a check for $100,000 each to pay off the debt, of which just in 2023 was $1.5 TRILLION.


All of which leads to this very distressing reality: all of this debt means that every year the American taxpayer is paying $1 TRILLION just to service the national debt. Not pay down the debt, just cover the interest payments.


And that burden is only growing since career politicians like Joe Biden have neither the ability, the brains, or desire to get government spending under control.


4)We have previously shown two wonderful examples that illustrates why it is is always stupid of politicians to continue to raise taxes in that more often than not when taxes rates are raised, tax revenue actually goes down:


  • Several years ago, the French raised the tax rates on wealthy earners in the country.

  • Rather than get increased tax revenue, the tax revenue from these wealthy earners as a group actually went down as the wealthy just left the country to lower taxing countries, taking their tax revenue with them.

  • A similar thing happened to the state of Maryland, also a few years ago.

  • The state government raised the tax rates on those citizens earning more than a million dollars a year.

  • Several years later, the tax revenue from state citizens earning over a million dollars a year had actually shrunk, despite a higher tax rate, since the wealthy citizens simply had the resources to move out of state to lower taxation states, taking their tax revenue with them.


And despite this history lesson, politicians rarely learn from history:


  • United Kingdom politicians are planning to raise the tax rates on the wealthy citizens in the country.

  • Reports are surfacing that high earning bankers, entrepreneurs, and business executives are already either planning to leave the country or have done so already even though the new higher tax rate on the wealthy have even become law yet.

  • Countries they are heading for include Italy, the United Arab Emirates, and Switzerland, all countries with much friendlier tax rates.


According to an article which, unfortunately I deleted by mistake, “In a world that should favor growth, it’s time for policymakers in Britain and similarly afflicted regions to understand that punitive taxation does not build successful economies; it merely depletes them.” 


Whether in France, England, Maryland or blue states, continuing to increase the tax rate on the wealthy only drives the wealthy to other, more tax friendly environs. But politicians continue to be too ignorant to understand basic human  nature.


That will  do it for today: alleged corruption in NYC, alleged corruption in  the Biden family,  national debt still  out of control, and stupid politicians continue to be economic idiots.


**********************

If you agree that we need to deseat every member of Congress for their lack of success and accomplishment, then please consider going to the following petition link to help the cause:


https://www.change.org/p/deseat-congress-reset-freedom


**********************


Our book, "Love My Country, Loathe My Government - Fifty First Steps To Restoring Our Freedom And Destroying The American Political Class" is now available at:

Monday, March 30, 2015

March, 2015, Part 2, By The Numbers: Out Of Control Spending By Washington and Its Economic Ignorance

On a semi-regular basis we revisit the theme ”by the numbers” just to check in on the state of the country and political class using actual realities and their underlying numbers, not the spin or lies from our politicians. You see, politicians usually have nothing to gain by looking at reality and the numbers since they are more than likely to have screwed up reality and our lives in the first place.

That is why they would rather lie and deceive than tell the truth. But that approach can be destroyed by looking at the hard numbers behind the mess they have created. I once worked for a boss whose favorite saying was: There is nothing more devastating to an opinion than the right number.” And that is what we try to do with this theme is devastate politicians’ opinions by looking at the right numbers.

So let’s take a look at the numbers that have recently cropped up and again prove that the political class in America continues to be one of the worst set of people to ever hold office, given the state of the country, the many ways they screw up our wealth and government functions, and their inability or non-desire to step up and tell the truth.

Today we finish up our discussion on “by the numbers” today using the latest analysis of government numbers and other numbers as done by the Heritage Foundation:

1) Anyone with a smidgen of math and number analysis abilities already realizes that government entitlement programs such as Social Security and Medicare are growing much faster than the economy. Simple number analysis show us that as the Baby Boomers retire and start using the promised benefits the political class promised them long ago relative to retirement income and retirement medical care, the cash crunch on the Federal government gets more and more unbearable and unpayable.

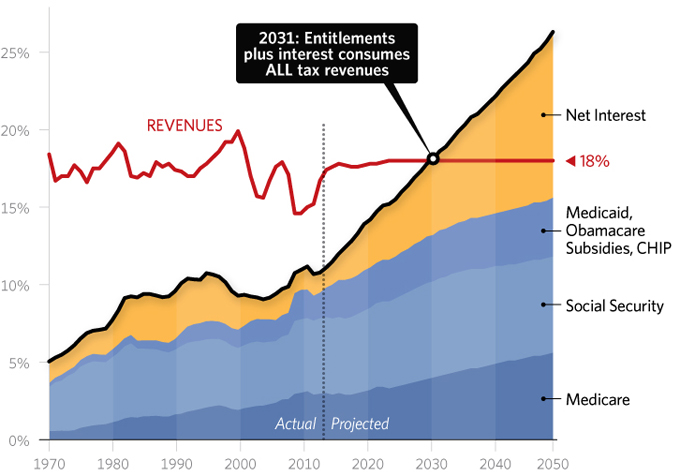
Using government data from the Congressional Budget Office and Office of Management and Budget, and assuming that the Federal government’s tax revenue stream will be equal to the long term average of 18%, by 2013, just 16 years from now, government entitlement programs and the interest that has to be paid on our $18 TRILLION national debt (which is growing every day), will be equal to the Federal government’s revenue stream.

This means that before the national defense is funded, before the EPA is funded, before the Departments of Energy, Transportation, Commerce, Education, and dozens of other government entities are funded, the Federal budget is already accounted for. And the situation gets worse after 2031 with government revenue failing to cover the entitlement and interest payments.


Sources: Congressional Budget Office and Office of Management and Budget.

The numbers do not lie: unless radical changes are made to the national debt and the promises embedded within the Federal government’s entitlement programs, there will be an unprecedented budget crisis very soon: the Federal government and the national economy cannot withstand business as usual in Washington.
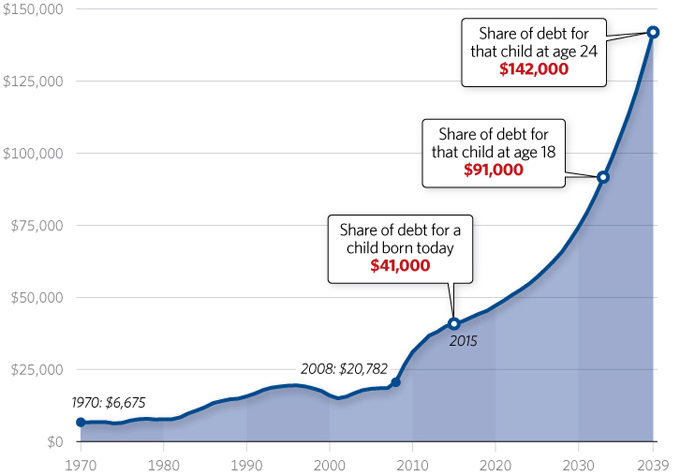
2) As we showed yesterday with Bill Gates wealth, there is no way to overcome the national debt hole that the Washington political class has dug for us. The Federal government spends too much, it does not tax too little. The above number analysis and the impending 2031 doom verifies that reality. But let’s get away from Bill Gates and talk about the debt burden on average Americans. Heritage did another analysis to show what the national debt burden is today and in the future for every American if each one took responsibility for a fair piece of that debt:
  • Just for the public part of the country’s debt load, a child born today will have a debt burden at birth of about $41,000.
  • By the time that child is 18 years old, their share of the national debt burden will more than double to $91,000.
  • Just six years later, their share of the national debt burden will be up over 50% to $142,000.
  • And these depressing numbers include only the so-called “public debt.” As non-public debt is converted to public debt, which has to happen at some point in the future, these numbers are much too low to capture the total and real devastating debt effects on future American generations.
Really depressing numbers for today’s youth. They get to pay off the wasteful and fraudulent spending of today’s politicians without any of the benefits from that debt. This is the number legacy we are leaving for our kids and grandkids unless we take immediate and drastic action to get Federal government spending under control.And make no mistake, the current set of Washington politicians are the most culpable. Our total national debt is up about 80%, eight TRILLION dollars just since Obama took office six short years ago. And that will be his numbers legacy to our kids, our grandkids and our history going forward, uncontrolled spending with no societal benefits in return.

PUBLIC DEBT PER CAPITA


Sources: Congressional Budget Office, Office of Management and Budget, and U.S. Census Bureau.

3) We have previously pointed out several examples where state politicians raised tax rates on the highest earning state residents, fully expecting to see those higher tax rates result in higher state government tax revenue.The most classic example was written up in the Wall Street Journal relative to the state of Maryland. That state raised the tax rates on the state’s highest earning residents but ended up getting LESS revenue from the same higher earning residents than prior to the tax rate.
What happened with this line of reasoning? In all likelihood those state residents, faced with paying more in taxes, simply moved out of state to avoid the higher Maryland tax rates. Thus, rather than seeing the tax revenue stream increase when tax rates were raised, the state ended up with less overall revenue despite the higher rates. People are not stupid, they will make the decisions that give them the most freedom, economic and political.Which gets us to the final number analysis from the Heritage Foundation. Over the past 50 years, the top Federal government income tax rate has varied from 91% to 28%. However, despite the wide range, Federal income taxes received as a percentage of the nation’s GDP has remained relatively constant. For example, according to IRS data, in 1990, the top Federal income tax rate was 28% which resulted in Federal income tax revenue to be equal to about 79% of the country;s GDP. In 2014, the the top Federal tax rate had jumped up to 39%, about 40% higher than in 1990, but the percentage of GDP was about the same, a smidgen higher at only 8.0%. Thus, despite Obama’s obsession with soaking the rich with higher tax rates, the bottom line is that there were not substantially higher tax revenues generated, as the IRS data below shows.
TOP TAX RATES AND TOTAL RECEIPTS


Source: Internal Revenue Service.

In other words, the top tax rate is inelastic economically compared to tax revenue as a percentage of GDP. Thus, why raise tax rates and reduce the economic freedom of Americans when lower tax rates results in about the same revenue as higher tax rates? Because the political class would rather try and control our lives, despite what the data, numbers, and realities tell us.
That will do it for this brief, two post update under our theme, “by the numbers.” What did we learn today from the numbers:
  1. Unless Washington changes its spending ways, soon the country will not be able to afford anything but interest payments on the national debt and entitlements.
  2. Unless Washington changes is spending ways, a child born today will be faced with a national debt burden of over $140,000 by the time they are 24 years old.
  3. Higher tax rates rarely, if ever,at both the state and Federal level, result in higher tax revenues.
The numbers do not lie, the numbers devastate opinions and spin of the political class. And unlike today’s politicians, starting in the White House, the numbers do not lie.Our book, "Love My Country, Loathe My Government - Fifty First Steps To Restoring Our Freedom And Destroying The American Political Class" is now available at:

www.loathemygovernment.com

It is also available online at Amazon and Barnes and Noble. Please pass our message of freedom onward. Let your friends and family know about our websites and blogs, ask your library to carry the book, and respect freedom for both yourselves and others everyday.

Please visit the following sites for freedom:

Term Limits Now: http://www.howmuchworsecoulditget.com
http://www.reason.com
http://www.cato.org
http://www.bankruptingamerica.org

http://www.conventionofstates.com
http://www.youtube.com/watch?v=08j0sYUOb5w


Sunday, March 29, 2015

March, 2015, By The Numbers, Part 1: Social Security Going Bust, Pentagon Losing Weapons, and More

On a semi-regular basis we revisit the theme ”by the numbers” just to check in on the state of the country and political class using actual realities and their underlying numbers, not the spin or lies from our politicians. You see, politicians usually have nothing to gain by looking at reality and the numbers since they are more than likely to have screwed up reality and our lives in the first place.

That is why they would rather lie and deceive than tell the truth. But that approach can be destroyed by looking at the hard numbers behind the mess they have created. I once worked for a boss whose favorite saying was: "There is nothing more devastating to an opinion than the right number.” And that is what we try to do with this theme, devastate politicians’ opinions by looking at the right numbers.

So let’s take a look at the numbers that have recently cropped up and again prove that the political class in America continues to be one of the worst set of people to ever hold office, given the state of the country, the many ways they screw up our wealth and government functions, and their inability or non-desire to step up and tell the truth.

1) One can really tell how inept our current politicians are by looking at how incompetently they operate government functions. According to a recent Social Security Administration (SSA) inspector general audit report, there are 6.5 million active Social Security numbers on file that indicate the owners of those numbers are over 112 years old but there is no record of their death. Given the reality that the 2013 Census update shows that there are just over 6 million living Americans in the country who are over 85 years old, it is highly doubtful there are 6.5 million Americans who are over 112 years old, the numbers make no sense.

But it does make sense if you consider the very real possibility that these Social Security numbers are still active because they are being used fraudulently to rip off the SSA and the American taxpayer. It could be that the sons and daughters of deceased holders of these SSA numbers are still receiving the SSA checks of their dead relatives. It could be that illegal aliens are using the numbers to get benefits or get jobs using dead folks’ SSA numbers. It could be that organized crime is using the numbers to get disability or retirement checks fraudulently. Whatever the cause, you can be sure that the American taxpayer is being ripped off. 

A couple of comments here:
  • Why did it take an auditor’s report to figure this out? 
  • Is the SSA so screwed up that they had no idea that millions of people could be ripping off the system?
  • Didn’t anyone there think to compare the characteristics of their list to the Census findings?
  • According to Wikipedia, there are a grand total of sixteen Americans confirmed to be over 110 years old living in the country today? Didn’t anyone at the SSA think that might be an easy and important number to look up?
Unbelievable incompetence that could be avoided with some simple number analysis. Here is another simple idea: find out who those sixteen Americans are who are over the age of 110, identify what their Social Security numbers are, and then deactivate the remaining 6.5 million numbers that the inspector general identified and then sit back and see who yells? Whoever yells is likely a criminal in some respect who can then be arrested for fraud. 

The others will likely melt away once they know the scam is over, saving the American taxpayer a lot of wealth. But even simple plans like these are too much for the political class to grasp so expect the 6.5 million number to hang around for a long time.

2) According to a recent Washington Post article, the Pentagon also has a numbers problem in that it is unable to account for $500 million worth of military aid given to the Yemeni government. Given that the Yemeni government was recently overthrown it is highly likely that the half a billion worth of taxpayer funded weaponry is now in the hands of one of three terror groups operating in Yemen: ISIS, Al Qaeda, or Iranian supported terrorists. Half a billion dollars, a nice round number used to fund terrorists.

3) The Heritage Foundation recently did some real nice number analyses regarding the Federal budget which should shake up a lot of people who have an opinion but no data to support their opinion. Let’s start with the fallacy that the wealthy in this country do not pay enough in taxes. 

Using Federal government tax data from 2011, the latest data available, Heritage’s analysis found that:
  • The top 10% earners in this country pay a whopping 68% of all Federal income taxes. 
  • The top 1% of earners pay more than a third of all Federal income taxes (35%).
  • Another way to look at the numbers is that the top 10% of earners earn 46% of the earnings in this country but pay 68% of all Federal income taxes, a tax to earnings ratio of almost 1.5, i.e. their share of taxes paid is 50% more than their share of earnings earned.
  • The top 1% of earners earn 19% of all earnings but pay 35% of all Federal income taxes, a tax to earnings ratio of 1.84, i.e. their share of taxes is 84% higher than their share of earnings earned.
  • The bottom 50% of earners earn 12% of earnings but pay only 3% of all Federal income taxes so their tax to earnings ratio is .25, i.e. their share of taxes is 75% lower than their share of earnings and their tax to earnings ratio is more than seven times lower than the ratio for the top 1% earners.
Given these numbers and results, it is pretty hard to make the case that the wealthy, higher earners do not pay their fair share of Federal income taxes. These numbers just reaffirm that we do not have an under taxation problem in this country, we have a Federal government over spending problem.

Another set of numbers to prove that there is not an under taxation problem in this country is to look at the wealth of Bill Gates, the wealthiest American, and the Federal government’s budget. The Federal government is spending money at the rate of about $10.4 billions per DAY. According to Forbes latest analysis, Bill Gates is worth about $78 billion. 

Rather than tax Bill Gates at a higher rate, let’s get crazy and say that somehow the Federal government confiscated everything he owned, about $78 billion worth of wealth. If we divide his wealth by the run rate of Federal spending we see that Gates’ entire wealth could operate the Federal government for just over seven days. His entire wealth, seven days, eight days tops of government operations.

If you just raise his tax rate, the increase in taxes collected would not even operate the Federal government for a few hours. We have a government that spends too much, we do not have a government that does not tax enough, the numbers do not lie.


4) Let’s dive deeper in the Heritage analysis, starting with Social Security numbers. The following numbers show the annual Social Security Administration cash flows over the years, adjusted for inflation, where a surplus means that in that year they collected more in Social Security taxes than what was paid out and deficit years means more was paid out than what was collected in Social Security taxes:

INFLATION-ADJUSTED DOLLARS (2014)


Source: Social Security Administration.

The numbers are pretty clear:

  • Up until 2009, the cash flow of the SSA was positive, i.e. it collected more in Social Security taxes than what it paid out in Social Security benefits, a good thing. 
  • But starting in 2010, that surplus turned negative with the deficit quickly growing to a whopping $79.7 billion in just five short years in 2014.
  • While the SSA forecasts a slight reduction in that deficit.negative cash flow in the next few years, given the current set of rules, numbers and realities of the Social Security system, deficits will soon skyrocket, reaching an annual deficit of $337 billion by 2032, four times higher than it is today.
This is just more proof that the Social Security “trust” is an accounting and numbers trick foisted on us by the political class. There is no trust fund. There is no pile of cash or stack of gold bars and sheets of Google stock that can be used to offset the growing negative cash flow. The trust fund is an accounting trick that the politicians used to get access to Social Security wealth long ago, leaving us with growing Social Security deficit numbers that will very soon be unpayable under the current benefit scheme. The numbers do not lie even if the politicians do when it comes to Social Security.That will do it for political numbers today, more to follow tomorrow. Today we learned that dead people still get Social Security benefits, the Pentagon lost half a billion dollars worth of military gear, the wealthy already pay most of our taxes, and Social Security is quickly becoming insolvent. The numbers do not lie.