That is why they would rather lie and deceive than tell the truth. But that approach can be destroyed by looking at the hard numbers behind the mess they have created. I once worked for a boss whose favorite saying was: There is nothing more devastating to an opinion than the right number.” And that is what we try to do with this theme is devastate politicians’ opinions by looking at the right numbers.
So let’s take a look at the numbers that have recently cropped up and again prove that the political class in America continues to be one of the worst set of people to ever hold office, given the state of the country, the many ways they screw up our wealth and government functions, and their inability or non-desire to step up and tell the truth.
Today we finish up our discussion on “by the numbers” today using the latest analysis of government numbers and other numbers as done by the Heritage Foundation:
1) Anyone with a smidgen of math and number analysis abilities already realizes that government entitlement programs such as Social Security and Medicare are growing much faster than the economy. Simple number analysis show us that as the Baby Boomers retire and start using the promised benefits the political class promised them long ago relative to retirement income and retirement medical care, the cash crunch on the Federal government gets more and more unbearable and unpayable.
Using government data from the Congressional Budget Office and Office of Management and Budget, and assuming that the Federal government’s tax revenue stream will be equal to the long term average of 18%, by 2013, just 16 years from now, government entitlement programs and the interest that has to be paid on our $18 TRILLION national debt (which is growing every day), will be equal to the Federal government’s revenue stream.
This means that before the national defense is funded, before the EPA is funded, before the Departments of Energy, Transportation, Commerce, Education, and dozens of other government entities are funded, the Federal budget is already accounted for. And the situation gets worse after 2031 with government revenue failing to cover the entitlement and interest payments.
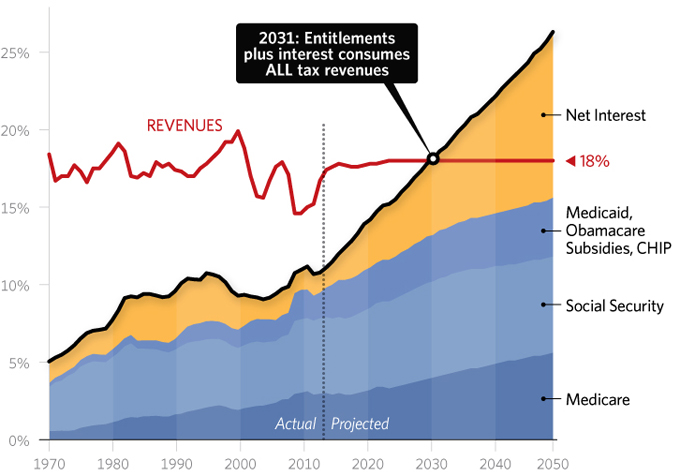
Sources: Congressional Budget Office and Office of Management and Budget.
The numbers do not lie: unless radical changes are made to the national debt and the promises embedded within the Federal government’s entitlement programs, there will be an unprecedented budget crisis very soon: the Federal government and the national economy cannot withstand business as usual in Washington.2) As we showed yesterday with Bill Gates wealth, there is no way to overcome the national debt hole that the Washington political class has dug for us. The Federal government spends too much, it does not tax too little. The above number analysis and the impending 2031 doom verifies that reality. But let’s get away from Bill Gates and talk about the debt burden on average Americans. Heritage did another analysis to show what the national debt burden is today and in the future for every American if each one took responsibility for a fair piece of that debt:
- Just for the public part of the country’s debt load, a child born today will have a debt burden at birth of about $41,000.
- By the time that child is 18 years old, their share of the national debt burden will more than double to $91,000.
- Just six years later, their share of the national debt burden will be up over 50% to $142,000.
- And these depressing numbers include only the so-called “public debt.” As non-public debt is converted to public debt, which has to happen at some point in the future, these numbers are much too low to capture the total and real devastating debt effects on future American generations.
PUBLIC DEBT PER CAPITA
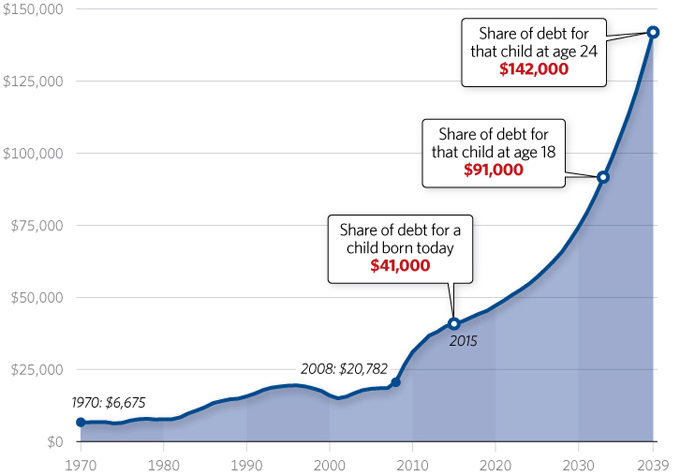
Sources: Congressional Budget Office, Office of Management and Budget, and U.S. Census Bureau.
3) We have previously pointed out several examples where state politicians raised tax rates on the highest earning state residents, fully expecting to see those higher tax rates result in higher state government tax revenue.The most classic example was written up in the Wall Street Journal relative to the state of Maryland. That state raised the tax rates on the state’s highest earning residents but ended up getting LESS revenue from the same higher earning residents than prior to the tax rate.What happened with this line of reasoning? In all likelihood those state residents, faced with paying more in taxes, simply moved out of state to avoid the higher Maryland tax rates. Thus, rather than seeing the tax revenue stream increase when tax rates were raised, the state ended up with less overall revenue despite the higher rates. People are not stupid, they will make the decisions that give them the most freedom, economic and political.Which gets us to the final number analysis from the Heritage Foundation. Over the past 50 years, the top Federal government income tax rate has varied from 91% to 28%. However, despite the wide range, Federal income taxes received as a percentage of the nation’s GDP has remained relatively constant. For example, according to IRS data, in 1990, the top Federal income tax rate was 28% which resulted in Federal income tax revenue to be equal to about 79% of the country;s GDP. In 2014, the the top Federal tax rate had jumped up to 39%, about 40% higher than in 1990, but the percentage of GDP was about the same, a smidgen higher at only 8.0%. Thus, despite Obama’s obsession with soaking the rich with higher tax rates, the bottom line is that there were not substantially higher tax revenues generated, as the IRS data below shows.
TOP TAX RATES AND TOTAL RECEIPTS

Source: Internal Revenue Service.
In other words, the top tax rate is inelastic economically compared to tax revenue as a percentage of GDP. Thus, why raise tax rates and reduce the economic freedom of Americans when lower tax rates results in about the same revenue as higher tax rates? Because the political class would rather try and control our lives, despite what the data, numbers, and realities tell us.That will do it for this brief, two post update under our theme, “by the numbers.” What did we learn today from the numbers:
- Unless Washington changes its spending ways, soon the country will not be able to afford anything but interest payments on the national debt and entitlements.
- Unless Washington changes is spending ways, a child born today will be faced with a national debt burden of over $140,000 by the time they are 24 years old.
- Higher tax rates rarely, if ever,at both the state and Federal level, result in higher tax revenues.
www.loathemygovernment.com
It is also available online at Amazon and Barnes and Noble. Please pass our message of freedom onward. Let your friends and family know about our websites and blogs, ask your library to carry the book, and respect freedom for both yourselves and others everyday.
Please visit the following sites for freedom:
Term Limits Now: http://www.howmuchworsecoulditget.com
http://www.reason.com
http://www.cato.org
http://www.bankruptingamerica.org
http://www.conventionofstates.com
http://www.youtube.com/watch?v=08j0sYUOb5w


No comments:
Post a Comment