- American politicians vote and act for their own personal interests first, Americans’ interests and well being being of secondary consideration. If a politician’s actions can get them more votes or more campaign cash for their perpetual reelection campaigns, than that is their priority, usually not the priorities of their constituents.
- Second, I personally believe that today’s American politicians take care of their special interest friends and financiers first and foremost, and the interests of those special interest friends (e.g.unions, corporations, lobbyists, etc.) are usually not in alignment with what the majority of Americans have as their priorities.
- The labor participation rate is still bouncing around at the same low levels not seen for the past four decades.
- Almost 14 million Americans are either unemployed or are working at part time jobs even though they would prefer full time jobs.
- Minority unemployment rates are still much higher than the total national unemployment rate.
- Over 45 million Americans are still receiving Federal food assistance every month.
 2) The Federal Reserve pumped fake, printed money into the economy to try and get the recovery underway. Unfortunately they kept pumping money into the economy even when the recession ended, increasing the money in the economy by ten fold. At some point, that much paper money will come back on an inflation tear:
 3) Somehow, and this is probably not easy, the Obama administration’s economic policies have somehow managed to reduce the median weekly earnings of average Americans AFTER the recession ended, dropping so far down that today’s median average wages are about where they were thirteen years ago in 2002.
 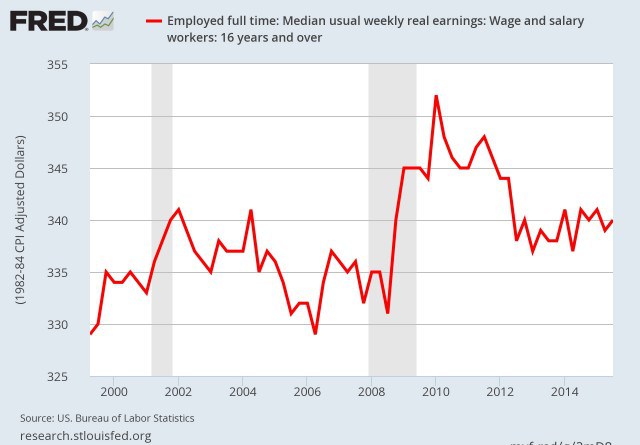 4) As we discussed yesterday, the Civilian Labor Force Participation Rate is at levels not since the dark economic days of the Carter administration. And even worse, the Obama administration’s economic policies have accelerated the drop in the participation rate AFTER the recession ended.
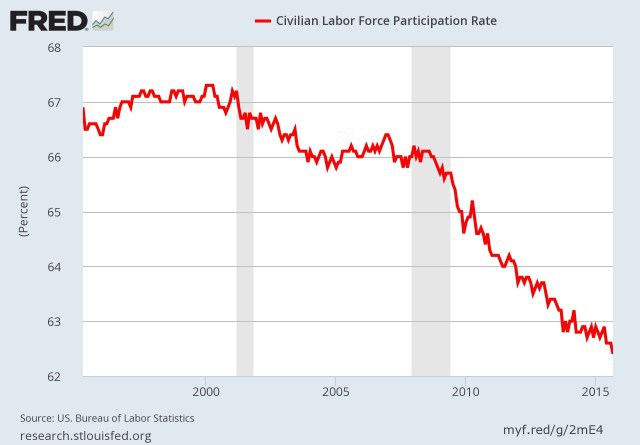 5) Although workers’ portion of the economy has been slowly declining over time, that trend accelerated during the Bush administration, paused during the recession, and then plunged again during the Obama administration AFTER the recession ended.
That will do it for today. We will finish the remaining Fed trend charts tomorrow. But the results and conclusions from those charts will not reach a different conclusion than this: the Obama administration, the current Congressional members, and Federal bureaucrats have saddled us with tremendous amounts of debt, stagnant wages, and tepid job creation. Seems you could not do a worse job managing the economy if you were trying to scew things up.Our book, "Love My Country, Loathe My Government - Fifty First Steps To Restoring Our Freedom And Destroying The American Political Class" is now available at:
www.loathemygovernment.com
It is also available online at Amazon and Barnes and Noble. Please pass our message of freedom onward. Let your friends and family know about our websites and blogs, ask your library to carry the book, and respect freedom for both yourselves and others everyday.
Please visit the following sites for freedom:
Term Limits Now: http://www.howmuchworsecoulditget.com
http://www.reason.com
http://www.cato.org
http://www.bankruptingamerica.org
http://www.conventionofstates.com
http://www.youtube.com/watch?v=08j0sYUOb5w


No comments:
Post a Comment